A Super El Niño… For Mortgage Rates?
Weather forecasters are sounding the alarm about a potentially historic El Niño developing this winter. NOAA currently says there is a greater than 90% chance it becomes a “very strong” event, with some models suggesting it could rival the strongest El Niños on record. Which naturally got me thinking about… mortgage rates.
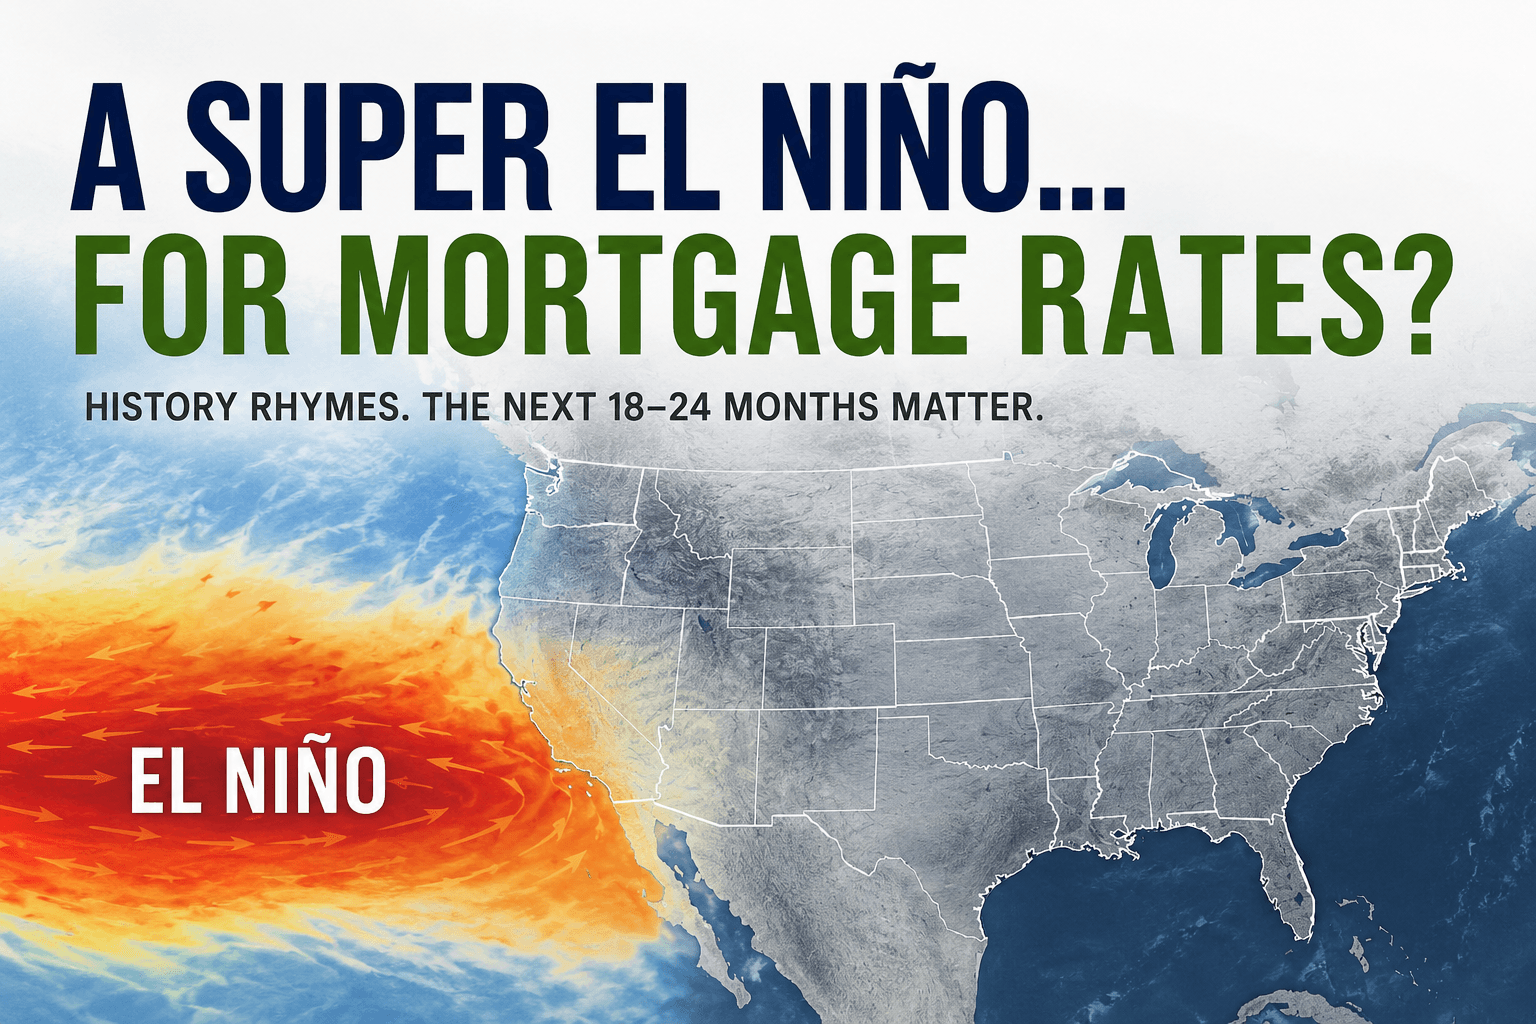
I know. My brain is aweird place.
To be clear, I’m not suggesting warm Pacific Ocean water causes mortgage rates to go up. But meteorologists and economists have something in common: neither can tell you exactly what will happen 12 or 18 months from now.
What they can do is look at current conditions, compare them with similar periods in history and ask a pretty simple question:
When we’ve seen this combination before, what happened next?
That’s what I’ve been doing.
And the period I keep coming back to is 1965.
Before anyone fires off an email accusing me of rooting for or against the current administration, let me save you the trouble. I’m not making a political argument.
Money isn’t red. Money isn’t blue.
I follow the color of money — green.
Republican deficits cost money. Democratic deficits cost money. Bond traders don't get a different yield because they like the person sitting in the Oval Office.
So let's leave the jerseys at the door and look at the numbers.
Welcome Back to 1965?
In the mid-1960s, America had a strong economy, low unemployment and relatively low inflation.
At the same time, Washington was dramatically increasing spending.
President Lyndon Johnson was attempting to fund both the Vietnam War and his ambitious Great Society domestic programs — a combination economists eventually nicknamed “guns and butter.”
The Federal Reserve was also under considerable political pressure not to raise interest rates and interfere with the administration's economic agenda.
Does any of this sound vaguely familiar?
For a while, everything seemed fine.
Mortgage rates certainly weren't sounding an alarm.
HUD data shows the 30-year FHA mortgage rate sitting at approximately 5.45% throughout 1964 and much of 1965.
Then the weather changed.
By June 1966, mortgage rates had climbed to 6.32%. By the end of 1966, they were approaching 7%.
They crossed 7.5% in 1968.
And by the summer of 1969?
8.35%.
That's roughly a 50% increase in mortgage rates from where the journey began.
Meanwhile, inflation — which had been only around 1% in 1964 — began accelerating.
The combination of Vietnam spending, domestic spending, an economy operating near full employment and monetary policy that remained accommodative for too long helped usher in what economists now call the Great Inflation.
Now hop back into the time machine and return to 2026.
This is where things get interesting.
1965 vs. 2026
Unemployment today remains around 4%, eerily similar to the full-employment environment of the mid-1960s.
But there's one pretty significant difference.
Inflation isn't starting around 1% this time.
It's already above the Federal Reserve's 2% target, following the largest inflationary episode in four decades.
Then there's Washington's checkbook.
The Congressional Budget Office projects the federal government will run approximately a $1.9 trillion deficit this year — about 5.8% of the entire U.S. economy.
Quick side trip, because someone will inevitably decide those numbers must have a political agenda:
The CBO is a nonpartisan agency. Its current director, Phillip Swagel, was originally appointed in 2019 during a divided Congress — a Democratic-controlled House and Republican-controlled Senate.
Okay. Back to the numbers.
The CBO describes sustained deficits of today's magnitude as “historically unusual” when unemployment remains below 5%.
That's worth reading again.
We're essentially running recession-sized deficits without being in a recession.
And here's where my comparison between the mid-1960s and today becomes even more interesting.
Federal debt held by the public was roughly 30% of GDP during the late 1960s.
Today?
Approximately 101% of GDP.
That doesn't guarantee higher mortgage rates.
But it sure changes the starting line.
Unlike 1965, we're already spending an enormous amount simply paying interest on our debt.
Higher interest rates increase the government's interest expense.
Higher interest expense contributes to larger deficits.
Larger deficits require the Treasury to borrow more money.
More borrowing means more Treasury bonds that investors have to absorb.
And investors ultimately decide what interest rate makes lending Uncle Sam money worthwhile.
Round and round we go.
So… 8% Mortgage Rates?
The national average 30-year mortgage rate is currently about 6.66%, according to Freddie Mac.
For mortgages to reach 8%, rates don't need to repeat anything close to the entire 1965–1969 move.
They need to increase just 1.34 percentage points.
That's it.
Here's another way to look at it.
If today's mortgage rates experienced the same percentage increase they experienced from 1964 to 1969, we'd actually be talking about mortgage rates north of 10%.
I'm NOT predicting that.
Please don't make me famous on the internet for predicting 10% mortgages.
What I am predicting is that the risk of mortgage rates reaching the upper-7% to 8% range during the next 18–24 months is considerably higher than the mortgage industry currently believes.
And yes, that's outside the mainstream forecast.
I'm comfortable there.
Vanilla Ice Cream Is Delicious
Most mainstream forecasts currently expect mortgage rates to either stay roughly where they are or mildly rise into the low 7s by this time next year.
That may prove correct.
But institutional economic forecasting has an understandable tendency toward vanilla ice cream.
Nobody gets laughed out of the conference room for predicting something reasonably close to everybody else's prediction.
“Rates probably stay around 6.875%” is vanilla.
Vanilla is delicious.
Vanilla is also rarely memorable.
My job is different.
I don't work for an economic think tank. I don't have shareholders wondering why my forecast is different from the other economists on CNBC.
It's okay for me to ring a bell and grab your attention.
I answer to you.
So rather than asking only what's most comfortable to forecast, I think it's useful to ask what the economic ingredients in front of us have produced before.
And I've been here before.
Some of you might remember my article back in April 2022. Mortgage rates were still in the 4s at the time, and much (and a majority) of the mortgage industry was forecasting that rates would actually settle down.
I went the other direction.
I said mortgage rates were headed to 7.625%.
I was told by some that the prediction was out of bounds — even irresponsible.
Who was right?
That wasn't a blind dart thrown at a board.
I reached that conclusion by comparing the post-COVID economy with previous post-crisis economic cycles and then looking for evidence that either supported or disproved the theory.
And here's the part those of you in the mortgage industry might remember.
At the time, probably the best-known mortgage-market forecaster in our industry was making almost the exact opposite call.
I'm intentionally leaving his name out because I respect him — but if you're in the industry, you probably know exactly who I'm talking about.
His forecast was that mortgage rates were eventually headed back into the 3's.
Mine was 7.625%.
Those aren't two economists arguing over whether rates will be 5.25% or 5.5%.
Those are two completely different views of what was happening in the economy.
And that's important.
Because my 7.625% call wasn't based on wanting to be controversial. I didn't start with a scary number and work backward trying to justify it.
I started with history.
I looked at what happened when an economy emerged from a massive disruption, when government stimulus collided with recovering demand, when supply couldn't keep up, and when inflation began appearing in places policymakers initially believed would be temporary.
Then I followed the breadcrumbs.
Mortgage rates ultimately climbed into the high 7s.
That doesn't mean I win every forecast.
It doesn't make me Nostradamus.
If it did, I'd be writing this from my yacht.
But it does mean that being outside the consensus doesn't particularly bother me.
I've stood there before.
And sometimes the problem with vanilla forecasting isn't that vanilla is wrong.
It's that everyone is staring at the same bowl of ice cream.
I'm willing to walk into the kitchen and see what else is cooking.
My Canary in the Coal Mine
I'm not throwing a dart and predicting 8% mortgage rates because it makes for a catchy headline.
I'm saying the ingredients necessary to create that outcome are already sitting on the kitchen counter:
· Persistent inflation.
· Low unemployment.
· Large government spending.
· Growing military expenditures.
· Political pressure surrounding monetary policy.
· Political pressure surrounding an unpopular foreign conflict.
· Historic deficits.
· A national debt dramatically larger than the one America carried during the 1960s.
And a bond market that eventually has to digest all of it.
Could I be wrong?
Absolutely.
Inflation could cool. Economic growth could slow. We could enter a recession. The Federal Reserve could successfully thread the needle and mortgage rates could eventually fall back into the 5s.
There is a path to lower rates.
But there is also a very logical path in the other direction.
And I don't think that path is getting nearly enough attention.
Okay Eric… If Rates Go Up, What Happens to Home Prices?
This is where my mortgage-rate forecast intersects with something else I've been writing about for the last couple of years:
Affordability.
I believe home prices in the Portland area are likely to decline in 2027.
Not crash.
Decline.
Those are very different words.
For the last few years, the housing market has been stuck in a strange stalemate.
Buyers are struggling with affordability.
Sellers are sitting on 3% mortgages and don't want to move.
So instead of prices dropping dramatically, we've largely seen something else disappear:
Transactions.
But eventually life wins.
People get married. People get divorced. Babies arrive. Kids leave. Jobs change. People retire. People pass away.
Eventually homes come onto the market whether their owners have a 3% mortgage or not.
And the buyer still has to qualify for the payment.
Consider a $600,000 home with 20% down.
At a 6.5% mortgage rate, principal and interest on the $480,000 loan is approximately $3,034 per month.
At 8%?
About $3,522.
Nearly $500 more every month for the exact same house.
Here's the part I find fascinating.
To get the payment back near $3,034 with an 8% mortgage rate, the loan would need to fall to roughly $414,000.
With 20% down, that translates into a purchase price around $518,000.
I'm absolutely NOT saying a $600,000 Portland home automatically becomes worth $518,000.
Housing doesn't work that neatly. I'm illustrating the pressure.
If mortgage rates rise and incomes don't rise enough to compensate, something eventually has to give.
The buyer can spend more. The buyer can buy less house.
Or…
The seller can accept less money.
And we're already seeing that negotiation begin.
Prices have softened. Homes are taking longer to sell. Price reductions are becoming increasingly common.
And that's happening with mortgage rates in the 6’s.
What happens if there's an 8 in front of them?
That's why I believe we'll see home prices decline in 2027 — modestly in my base case, potentially more meaningfully if mortgage rates move toward 8% and stay there.
And here's the cruel irony:
Falling home prices don't necessarily mean homes become more affordable.
If the price falls 5% but the mortgage rate climbs another 1½%, the monthly payment can still be worse.
I believe mortgage rates are more likely to move higher over the next 18–24 months than substantially lower.
I believe the probability of seeing mortgage rates in the upper-7% to 8% range during that period is significant.
And if the fiscal and inflationary parallels with the mid-1960s continue to develop, an 8% mortgage rate isn't some wild, doomsday prediction.
It's math.
We are starting around 6.66%.
Getting to 8% requires another 1.34%.
The comparable historical period produced a move several times larger than that.
I hope I'm wrong. Seriously.
Lower mortgage rates would be better for housing affordability, better for my business and considerably easier to explain at cocktail parties.
But my job isn't to tell you what I want to happen.
It's to tell you what I see.
In 1965, mortgage rates sat quietly around 5½% while fiscal and inflationary pressures accumulated underneath the surface.
Four years later, they were above 8%.
History rarely repeats itself perfectly.
But every once in a while, it looks out the window, checks the forecast and says:
You might want to bring an umbrella.