2026 Portland, OR Housing Forecast
-10%
Don't be suprised if prices decline into the low double digits vs Summer 2025
5.625%
Good news, mortgages rates will likely fall. Bad news, they'll come back up
60-70 Days
Homes May Sit for 2+ Months come summer 2026, longer in the off season
This is my favorite article of the year to write. The beginning of each year gives us a fresh perspective to look back at last year’s housing data and combine it with current (and projected) economic conditions. From there, we can build a comprehensive forecast for the many components and levers that drive both home prices and mortgage rates.
With that… let’s dive in!
Home Prices:
What we learned in 2025 is that there is no longer a “one size fits all” prediction for home prices across the U.S.
Pricing fluctuations are highly regionalized — more so than at any point I can remember in recent history.
Home prices in the Northeastern U.S. are climbing as if we were still in the heart of the pandemic. Low inventory continues to keep that region firmly in a sellers’ market.
The Southeast, on the other hand, is seeing pricing declines due to an overabundance of inventory. The hypothesis here is that rising insurance costs — particularly in places like Florida (where hurricane insurance on a single-family home can run $5,000–$10,000 per year) — as well as Texas, are causing some homeowners to peel vacation homes and rental properties out of their investment portfolios.
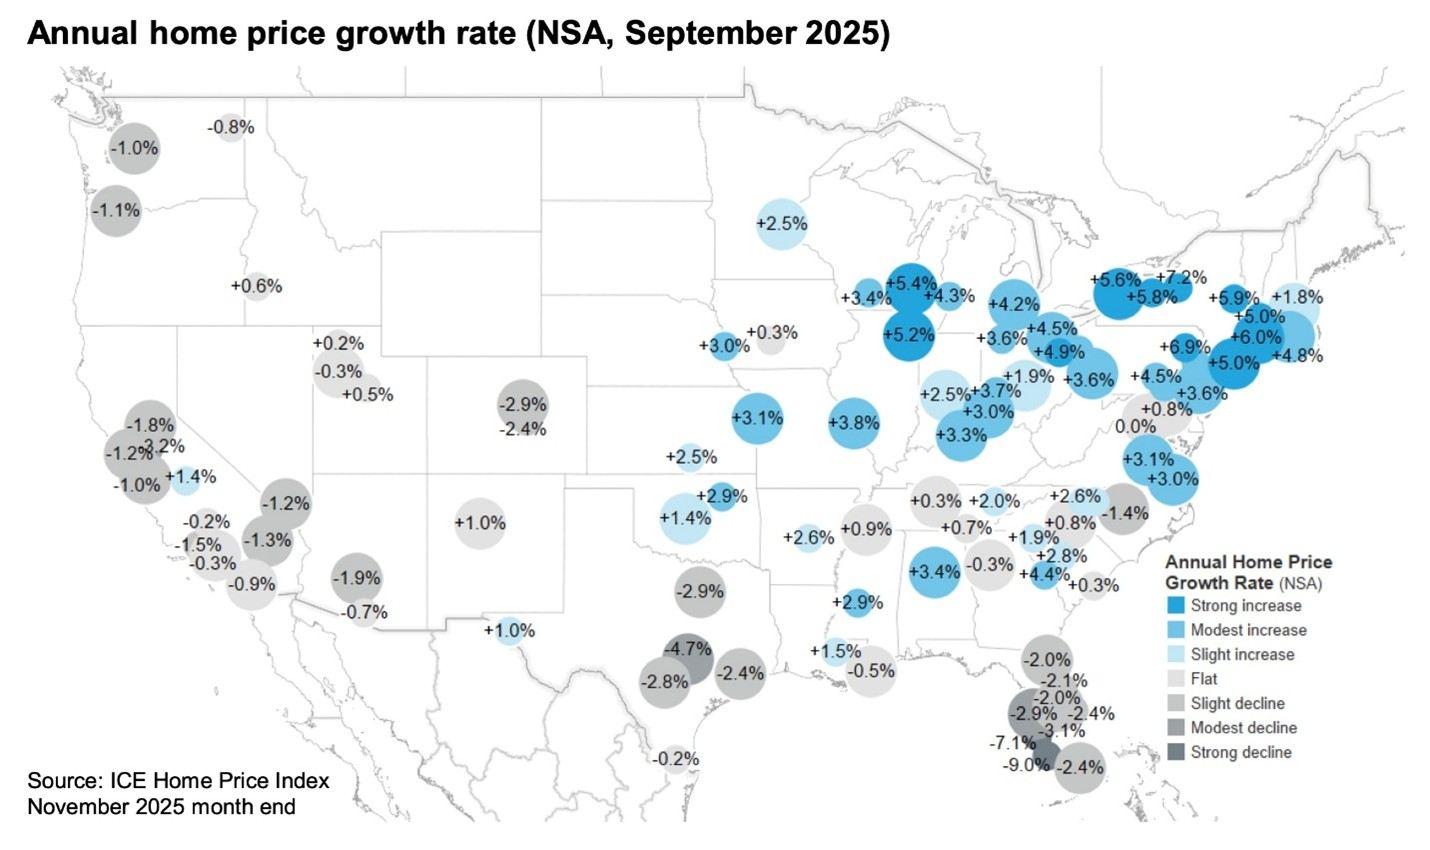
As you can see, California, Oregon, and Washington all appear to be in the same boat, with home prices starting to slip year over year. I do think there’s a strong likelihood that pricing declines further as we move forward — perhaps as much as 10% when comparing the summer 2025 peak to what is typically the lowest pricing month of the year, February 2026.
Conditions exist for pricing to remain soft through the summer of 2026. Don't confuse pricing with activity, though. Nearly every economist's compass is point torward more total transactions in 2026.
The reason? Affordability should get betting.
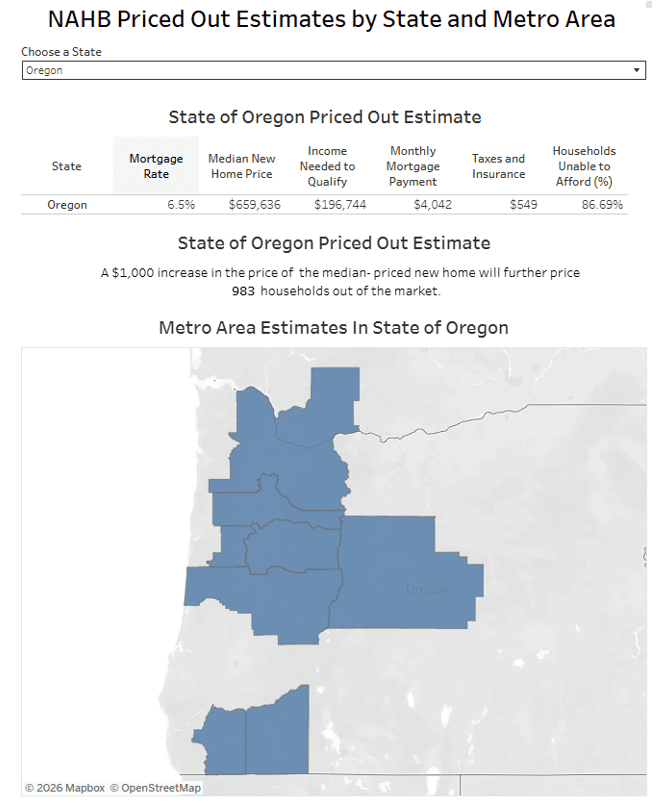
The National Association of Home Builders recently published a study (and did an excellent job breaking down the data) showing that for every $1,000 drop in home price, 983 additional families in the highlighted region below (essentially Western Oregon) are able to enter the housing market from an affordability standpoint — if they choose to do so.
At a median home price of $659,636 in Western Oregon, a 10% price drop would allow an astonishing 64,843 households to enter the home-buying conversation.
More homebuyers means more demand, which typically tilts negotiations in favor of sellers. However, in the Portland Metro area, each of the last 36 months has seen an increase in active listings year over year — and there’s nothing to suggest the next 12 months will be any different. Lets look at the chart below.
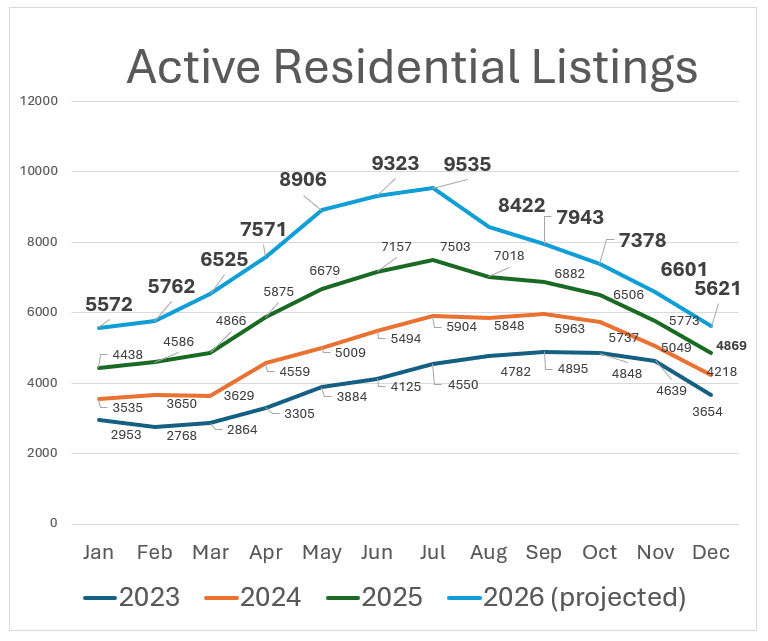
If we simply see the same year-over-year percentage increase in active listings in 2026 as we did in 2025, there’s a real chance that summer could bring close to (or even over) 9,000 active listings in a single month.
For perspective, that would exceed where we were when mortgage rates were in the 3% range during the heart of the pandemic housing boom (an average of about 8,500 listings per month in July, August, and September of 2019).
More homes on the market also means more time on the market. As shown in the chart below, average days on market — just like active listings — have increased year over year in each of the last 36 months. Again, there’s nothing pointing to a reversal in the next year. The time on market you see below has the same sort of year over year layers. This really isn't typical market behavior by the way. Normally lines are intersecting and going different directions. What the charts show is that we've had the SAME market conditions for the past 36 months and now heading into the another 12.
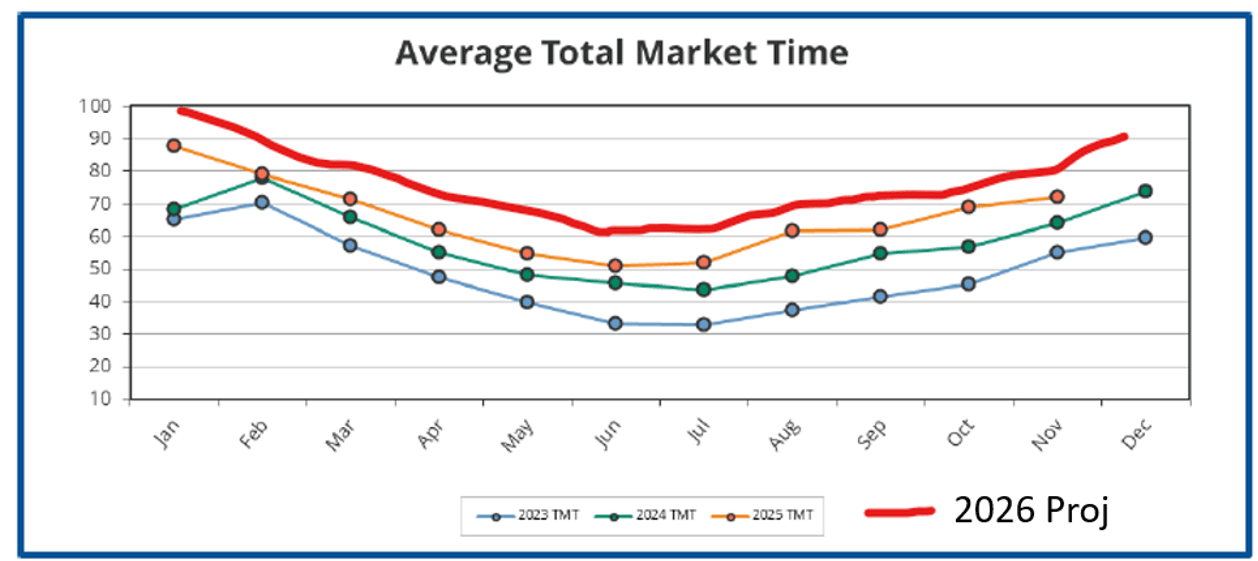
Lets zoom in on summer: In June of 2023, sellers expected their homes to sell in fewer than 35 days. Reality in the summer of 2026 could look very different, with days on market potentially nearly double that. In the wetter months, there’s a real chance we see 100+ days on market. A recent Redfin report showed that my ZIP code in West Portland (97229) averaged 97 days on market in December 2025.
Do you see what I mean? If the forecast includes an all-time high in listings combined with double the time on market compared to just two years ago, sellers are likely to become more impatient — and more willing to sacrifice price (and some equity) just to get a sale completed.
BOTTOM LINE ON HOME PRICES: Portland is shaping up to be a stronger market for buyers in 2026. Don’t be surprised if prices decline month over month when compared to the same months in 2025.
Mortgage Rates:
2025 saw mortgage rates rise over the summer, only to fall again in November and December. In fact, rates are now lower than they were at any point in 2025 — the lowest we’ve seen since October of 2024.
Looking ahead to 2026, instead of the “up and down the hill” pattern we experienced in 2025, I expect the reverse. Rates may fall heading into the summer buying season and then climb again in the second half of the year.
The reason for this forecast (and I’ll officially go on the record here — I’m the only person I see offering a month-by-month rate outlook, as most economists provide just a single annual prediction):
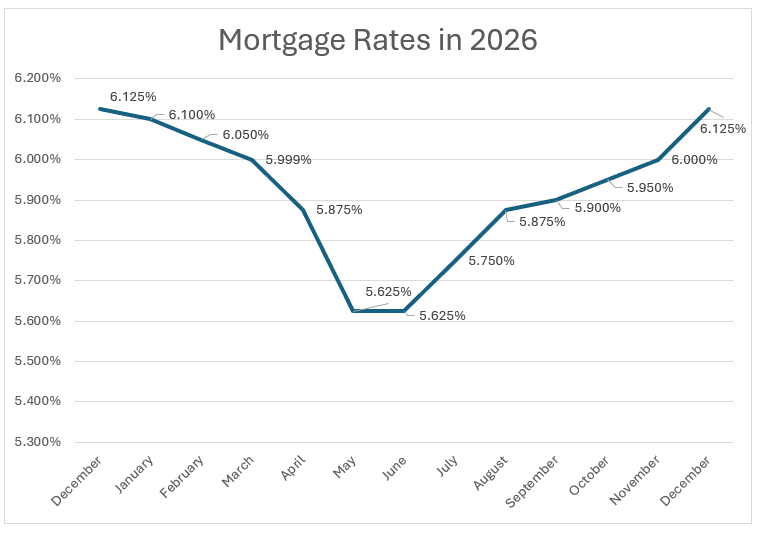
Why the dip and then the climb in rates that you see above?
In the spring, rates could dip into the higher 5% range on excitement surrounding a new Fed Chair and a potential Federal Funds rate cut in spring 2026.
The under-the-radar headline is that the Federal Reserve’s economic tightening strategy has effectively ended when it comes to Mortgage-Backed Securities (MBS). They decided to stop selling MBS on the open market in December 2025. Removing that competitor has helped lenders — and I believe that’s part of the reason rates fell each week throughout December.
Later in 2026, we may see rates creep back up as the Treasury issues more short-term bonds to help fund the “Big Beautiful Bill,” especially if tariff revenue comes in lower than expected. Rather than selling MBS, the Federal Reserve has announced plans to increase the issuance of short-term Treasury bonds, effectively increasing the U.S. debt load.
What could change this forecast?
- Unemployment. Mortgage rates tend to fall when there’s bad economic news. Some have been warning about a recession for the past 2–3 years, while others have pointed to Powell’s “soft landing” for just as long. Are we still on the runway — or have we finally reached the gate?
- Cuba, Colombia, and Venezuela. Increased tensions in South America could lead to higher government spending, and other foreign adversaries may respond by shifting their own chess pieces — potentially pushing rates higher.
- America’s personal debt. Even with relatively strong employment, there may come a moment when we collectively realize just how overleveraged we are. Mortgages, auto loans, credit cards, student loans — total consumer debt now sits around $18.3 trillion. An increase in defaults would absolutely impact the rates being charged.
Obviously, this is just a look at where the tea leaves currently lie. Someone else reading this same data could have a different opinion. One thing you can be sure of though... I'll be here for you each and every step of the way. Here's to an amazing 2026!
Eric Simantel
Eric@RyderMortgageGroup.com